資料庫效能 — 如何知道資料庫目前在忙什麼?

當遇到 query 查詢很慢的時候,會有一個疑問目前的 SQL server 正在忙什麼事情?
因此,SQL server 提供一個很好的工具可以得知”目前” SQL Server 忙碌的狀態
Management Studio > 右鍵 > Active Monitor
ActiveMonitor 就會顯示每一個 task 執行的狀況,如下圖所示
如果遇到因為 Blocking 的問題,Task State 就會出現 Suspended,
接著就可以進一步查詢 Wait Type & Wait Resource
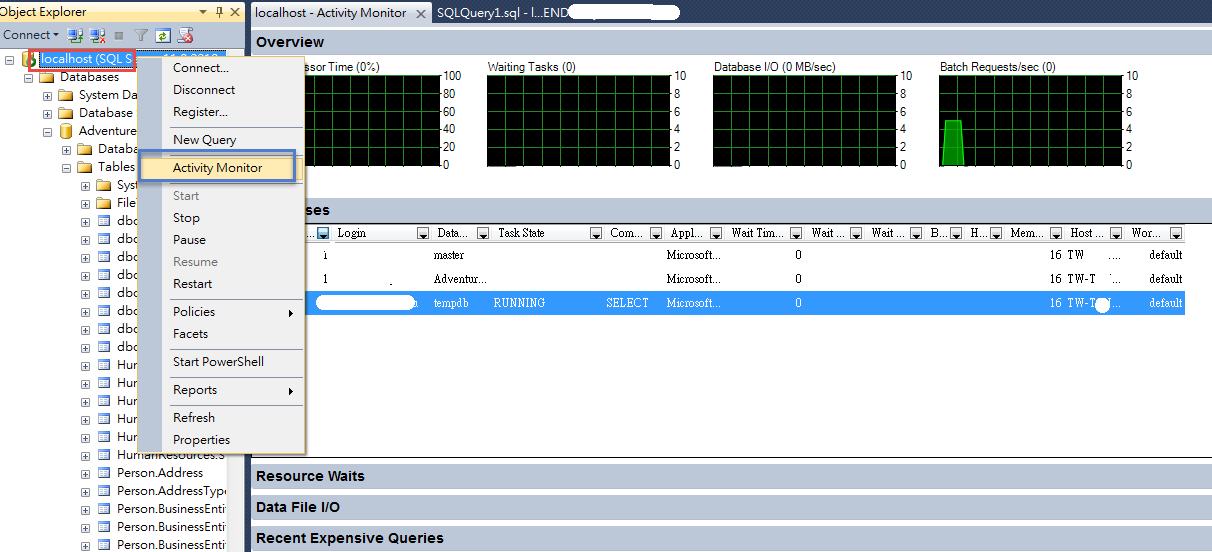
這是一個比較快的方式得知 “目前” SQL Server 忙碌與處理的即時資訊
Wait Resource
針對會導致 SQL Blocking 的 Wait Resource分述如下,這邊介紹幾種常見的 Wait Resource
- ASYNC_NETWORK_IO—雖然該Wait 表示是網路的等待,但是大多情況下,都是因為用戶端應用程式處理時間過程造成 SQL Server 等待所造成。因此可以檢查該用戶端是否花比較多時間處理回應 SQL Server.
- CXPACKET—這個WaitType 主要是因為平行處理所造成。因為先完成的 thread必須要等待到需要時間最久的thread完成,整個工作才算完成。過多的 CxPacket也有可能是 Query 語句寫法造成。如果有很多 CxPacket 與Io_PageLatch就有可能是 Table Scan所造成。
- OLEDB—常見的原因有可能是 DBCC 或是BULK INSERT指令的執行所造成。
- PAGEIOLATCH_EX—Buffer latches including the PAGEIOLATCH_EX wait type are used to synchronize access to BUF structures and associated pages in the SQL Server database. The most frequently occurring buffer latching situation is when serialization is required on a buffer page.
- SOS_SCHEDULER_YIELD—當有比較高的 CPU 使用或是 CPU 瓶頸的時候, SOS_SCHEDULER_YIELD wait type也比較高,表示資源必須等待比較久的時間CPU才能夠處理。
- WRITELOG—通常表示磁碟寫入的動作,例如 Transaction log。
| Wait_Type | Area | Usage | Version | Description | Action |
| ASYNC_IO_COMPLETION | I/O | Resource | SQL 2005;SQL 2008 | Used to indicate a worker is waiting on a asynchronous I/O operation to complete not associated with database pages | Since this is used for various reason you need to find out what query or task is associated with the wait. Two examples of where this wait type is used is to create files associated with a CREATE DATABASE and for “zeroing” out a transaction log file during log creation or growth. |
| CHECKPOINT_QUEUE | Buffer | Background | SQL 2005;SQL 2008 | Used by background worker that waits on events on queue to process checkpoint requests. This is an “optional” wait type see Important Notes section in blog | You should be able to safely ignore this one as it is just indicates the checkpoint background worker is waiting for work to do. I suppose if you thought you had issues with checkpoints not working or log truncation you might see if this worker ever “wakes up”. Expect higher wait times as this will only wake up when work to do |
| CHKPT | Buffer | Background | SQL 2005; SQL 2008 | Used to coordinate the checkpoint background worker thread with recovery of master so checkpoint won’t start accepting queue requests until master online | You should be able to safely ignore. You should see 1 wait of this type for the server unless the checkpoint worker crashed and had to be restarted.. If though this is technically a “sync” type of event I left its usage as Background |
| CXPACKET | Query | Sync | SQL 2005;SQL 2008 | Used to synchronize threads involved in a parallel query. This wait type only means a parallel query is executing. | You may not need to take any action. If you see high wait times then it means you have a long running parallel query. I would first identify the query and determine if you need to tune it. Note sys.dm_exec_requests only shows the wait type of the request even if multiple tasks have different wait types. When you see CXPACKET here look at all tasks associated with the request. Find the task that doesn’t have this wait_type and see its status. It may be waiting on something else slowing down the query. wait_resource also has interesting details about the tasks and its parallel query operator |
| DISKIO_SUSPEND | BACKUP | Sync | SQL 2005; SQL 2008 | Used to indicate a worker is waiting to process I/O for a database or log file associated with a SNAPSHOT BACKUP | High wait times here indicate the SNAPSHOT BACKUP may be taking longer than expected. Typically the delay is within the VDI application perform the snapshot backup. |
| FT_IFTS_SCHEDULER_IDLE_WAIT | Full-Text | Background | SQL 2008 | Used by a background task processing full-text search requests indicating it is “waiting for work to do:” | You should be able to safely ignore unless some unexplained FTS issue. High wait times are normal |
| IO_COMPLETION | I/O | Resource | SQL 2005; SQL 2008 | Used to indicate a wait for I/O for operation (typically synchronous) like sorts and various situations where the engine needs to do a synchronous I/O | If wait times are high then you have a disk I/O bottleneck. The problem will be determining what type of operation and where the bottleneck exists. For sorts, it is on the storage system associated with tempdb. Note that database page I/O does not use this wait type. Instead look at PAGEIOLATCH waits. |
| KSOURCE_WAKEUP | Shutdown | Background | SQL 2005;SQL 2008 | Used by the background worker “signal handler” which waits for a signal to shutdown SQL Server | You should able to safely ignore this wait. You should only see one instance of this wait but in SQL Server 2008 what will be unusual is the wait time will show up as 0 in sys.dm_os_wait_stats. Other DMVs like sys.dm_exec_requests will show the SIGNAL_HANDLER with a high wait time of this type. |
| LAZYWRITER_SLEEP | Buffer | Background | SQL 2005;SQL 2008 | Used by the Lazywriter background worker to indicate it is sleeping waiting to wake up and check for work to do | You should be able to safely ignore this one. The wait times will appear to “cycle” as LazyWriter is designed to sleep and wake-up every 1 second. Appears as LZW_SLEEP in Xevent |
| LOGBUFFER | Transaction Log | Resource | SQL 2005; SQL 2008 | Used to indicate a worker thread is waiting for a log buffer to write log blocks for a transaction | This is typically a symptom of I/O bottlenecks because other workers waiting on WRITELOG will hold on to log blocks. Look for WRITERLOG waiters and if found the overall problem is I/O bottleneck on the storage system associated with the transaction log |
| LOGMGR_QUEUE | Transaction Log | Background | SQL 2005; SQL 2008 | Used by the background worker “Log Writer” to wait on a queue for requests to flush log blocks to the transaction log. This is an “optional” wait type see Important Notes section in blog | You should be able to safely ignore this wait type unless you believe a problem exists in processing log blocks to flush to the transaction log. This wait type is not a wait indicating I/O bottlenecks. It is only for waiting for other workers to request log block flushes. Note that on SQL Server 2005 this wait type will not show up in sys.dm_exec_requests because the Log Writer task does not show up there. |
| MISCELLANEOUS | Ignore | Ignore | SQL 2005;SQL 2008 | This really should be called “Not Waiting”. | This may have been used in SQL 2000 but for 2005/2008, it is not used for any valid wait. It is simply the default wait in a list and isn’t used to indicate any real waiting. This type shows up twice in sys.dm_os_wait_stats in SQL 2008 but the “other” instance is an older unused wait type in the code. We should be able to remove it. |
| PREEMPTIVE_XXX | Varies | External | SQL 2008 | Used to indicate a worker is running coded that is not under the SQLOS Scheduling Systems | I will specific PREEMPTIVE_XX wait types or groups of them in 2010. Be sure to read the Important Notes section for bug where this wait type is being over counted by the engine in some situations. Note also that when you see this wait_type in sys.dm_exec_requests the status of the request is RUNNING not SUSPENDED. This is because the engine doesn’t really know if the thread is waiting or running “external” code. |
| REQUEST_FOR_DEADLOCK_SEARCH | Lock | Background | SQL 2008 | Used by background worker “Lock Monitor” to search for deadlocks. This is an “optional” wait type see Important Notes section in blog | You should be able to safely ignore this one as it is just and indication the lock monitor thread is temporarily sleeping before it wakes up to do work. This wait type should never exceed 5 seconds in one “wait” as this is the interval the lock monitor wakes up to check for deadlocks |
| RESOURCE_QUERY_SEMAPHORE_COMPILE | Query | Resource | SQL 2005; SQL 2008 | Used to indicate a worker is waiting to compile a query due to too many other concurrent query compilations that require “not small” amounts of memory. | This is a very complicated problem to explain. The problem is more than just concurrent compilations. It is the amount of memory required by the compilations. Typically this problem is not seen on 64bit systems. The biggest thing you can do is find out why you have so many compilations. Furthermore, a high amount of “query memory” can result in less memory available for compilations so check what other users are consuming high query memory. |
| RESOURCE_SEMAPHORE | Query | Resource | SQL 2005; SQL 2008 | Used to indicate a worker is waiting to be allowed to perform an operation requiring “query memory” such as hashes and sorts | High wait times indicate too many queries are running concurrently that require query memory. Operations requiring query memory are hashes and sorts. Use DMVs such as dm_exec_query_resource_semaphores and dm_exec_query_memory_grants |
| SOS_SCHEDULER_YIELD | SQLOS | Forced | SQL 2005;SQL 2008 | Used to indicate a worker has yielded to let other workers run on a scheduler | This wait is simply an indication that a worker yielded for someone else to run. High wait counts with low wait times usually mean CPU bound queries. High wait times here could be non-yielding problems |
| SQLTRACE_BUFFER_FLUSH | Trace | Background | SQL 2005;SQL 2008 | Used by background worker | You should be able to safely ignore unless some unexplained problem with SQLTrace files not getting written to disk properly. |
| THREADPOOL | SQLOS | Resource | SQL 2005; SQL 2008 | Indicates a wait for a task to be assigned to a worker thread | Look for symptoms of high blocking or contention problems with many of the workers especially if the wait count and times are high. Don’t jump to increase max worker threads especially if you use default setting of 0. This wait type will not show up in sys.dm_exec_requests because it only occurs when the task is waiting on a worker thread. You must have a worker to become a request. Furthermore, you may not see this “live” since there may be no workers to process tasks for logins or for queries to look at DMVs. |
| WRITELOG | I/O | Sync | SQL 2005; SQL 2008 | Indicates a worker thread is waiting for LogWriter to flush log blocks. | High waits and wait times indicate an I/O bottleneck on the storage system associated with the transaction log |
| XE_DISPATCHER_WAIT | XEvent | Background | SQL 2008 | Used by a background worker to handle queue requests to write out buffers for async targets | You should be able to safely ignore this unless you believe a problem is occurring with processing of events for async targets. Since this works on a queue you can have bursts of high wait times especially when no XEvent sessions are active. |
| XE_TIMER_EVENT | XEvent | Background | SQL 2008 | Used to indicate a background task is waiting for “expired” timers for internal Xevent engine work | You should be able to safely ignore this one. Just used by the Xevent engine for internal processing of its work. If something was possibly wrong with Xevent processing you might see if this thread ever “wakes up” |
PageIOLatch vs PageLatch vs Latch_xx
Latch 是什麼? 這幾種有什麼不同?
Latch 主要是記憶體中資源物件的鎖定,類似 Locks 的一種
與 Locks 不同的是, Latch 為 SQL engine 自行決定調整,
一旦讀取完畢 Latch 就會立刻被釋放
PageIOLatch 與PageLatch 最大的不同是有沒有 Disk I/O 的存取
如果有很大量的 PageIOLatch 那可以用 DMV (io_virtual_file_stats)進一步查看忙碌的檔案與資料庫
如果有大量的 Latch ,也可以用 sys.dm_os_latch_stats 來查看
總結
這篇文章介紹了,如何查看 SQL 目前正在忙什麼,可以利用 Active Monitor 得知
也介紹幾種 WaitType ,與可能的原因,如何進一步處理,
以及如何用 DMV 進一步的查詢,
資料庫效能的問題通常要多方收集資訊,綜合考量才會比較有效果。