Java Performance profiling Tools
This article will explain some programming tips that will help Java programming. We are going to explore the rationale why some Java application is running slower than expected, tips to identify the deadlock, tools to monitor Java thread/methods call and improve the performance.
System Resource
To identify why a Java application is running slow, we need to determine what cause it.
The 4 key system resource are –
- CPU
- Memory
- Disk
- Network
We need to identify which system resource is the key bottleneck. The tuning process can take several iterations. It’s common that originally memory issue problems solved, and become a CPU or disk issue.
| Resource Bottleneck | Potential Actions | |
| CPU |
|
|
| Memory |
|
|
| Disk |
|
|
| Network |
|
How much time it takes?
Here is sample code that we can do in the Java to record how much time it takes for certain function or method call.
[pastacode lang=”java” message=”How much time it takes?” highlight=”6,7,16″ provider=”manual”]
public class SystemTime
{
	public static void main(String[] args) throws InterruptedException
	{

		// record the start time
		long time =  System.currentTimeMillis( );


		// do something loop here
		for (int i=1; i <= 3; i++){
			Thread.sleep(1000);
		}


		// print the time took for the execution
		time = System.currentTimeMillis( ) - time;
		System.out.println(" The test took " + time + " milliseconds");

	}
}
[/pastacode]
Profiling Tools
To measure or benchmark performance, here are some recommended tools we may use.
| System Resource | Tool |
| Network | netstat |
| CPUDiskProcess/thread | Linux: top, ps, iostat, vmstatWindows: Task Manager, Typeperf |
Java Monitoring Tools
These tools are built-in with JDK and can be executed under console mode.
Jconsole and jvisualvm are recommended since these two tools will provide you a comprehensive view of performance metrics in graphical GUI.
| Java Tools | Usage |
| jcmd | Prints basic class, thread, and VM information for a Java process. |
| jconsole** | It provides a GUI interview JVM activities, including thread usage, class usage, and GC activities. It can also be used to detect deadlock. |
| jhat | Reads and helps analyze memory heap dumps. This is a postprocessing utility. |
| jmap | heap dumps and other information about JVM memory usage |
| jinfo | visibility into the system properties of the JVM |
| jstack | stacks of a Java process |
| jstat | GC (Garbage Collection) |
| jvisualvm** | A GUI tool to monitor a JVM, profile a running application |
Java Profiling by — Java Mission Control
Java Mission Control shows profiling information from recording over period of time.
How to launch it? Just type “jmc” under command console

Profiling for Specific Class
| java -Xrunhprof:cpu=samples,thread=y <classname> |
For example, the class file name is “TestingClass.class”. You may input the following command in the console.
| java -Xrunhprof:cpu=samples,thread=y TestingClass |
Once the class execution is done, it will generate the profiling log file. “java.hprof.txt”
Here is the sample out of the java.hprof.txt file. It tells the “method” call per usage.
Be aware that this option “-Xrunhprof” is only used for testing and profiling not for production. Uses of the option will make the application slower from 10~1000%!
[pastacode lang=”markup” message=”Java Profiling Sample” highlight=”” provider=”manual”]
CPU SAMPLES BEGIN (total = 224) Wed Apr 15 15:15:05 2015
rank   self  accum   count trace method
   1 62.50% 62.50%     140 300056 java.lang.Thread.sleep
   2  4.46% 66.96%      10 300079 sun.misc.FDBigInteger.quoRemIteration
   3  3.13% 70.09%       7 300083 java.lang.Long.getChars
...
...
  34  0.45% 97.32%       1 300086 sun.misc.FDBigInteger.cmp
  35  0.45% 97.77%       1 300087 sun.misc.FDBigInteger.valueOfMulPow52
  36  0.45% 98.21%       1 300054 java.lang.Thread.currentThread
  37  0.45% 98.66%       1 300053 sun.misc.FDBigInteger.multBy10
  38  0.45% 99.11%       1 300069 sun.misc.FloatingDecimal$BinaryToASCIIBuffer.dtoa
  39  0.45% 99.55%       1 300089 ProfileTest.main
  40  0.45% 100.00%       1 300039 java.security.Permissions.add
CPU SAMPLES END
[/pastacode]
Compressed JAR File
The Java class file can be compressed into JAR file. The example below will generate the ClassName.Jar based on ClassName.class.
| jar cef ClassName ClassName.jar ClassName.class |
https://docs.oracle.com/javase/8/docs/technotes/tools/windows/jar.html
Then, the execution will be –
| java -jar ClassName.jar |
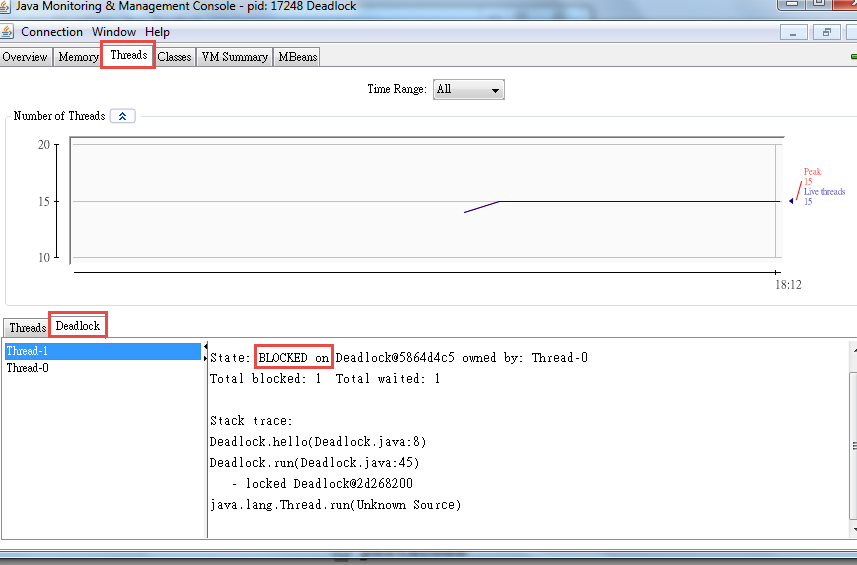
Deadlock Detection
Under the command console, type. “Jconsole”.
It will launch the Java Monitoring console as below, and ask which Java application process to monitor. Under the Threads tab, there will be “detect DeadLock” button. It’s very useful to detect which thread was blocked and the root/cause.