資料庫效能調教 – Execution Plan 有話要說

當Query 傳送到資料庫執行時,Query Optimizer 會針對 query 語句進行計算,
怎樣的執行方式會相對比較少的成本 Cost,決定相對比較少成本的 Cost 之後就開始執行
舉例來說,下列這三個 Query:
select * from [HumanResources].[Employee]
select * from [HumanResources].[Employee] where OrganizationLevel > 3
select * from [HumanResources].[Employee] where businessEntityID = 1
Ctrl + M (Include Actual Execution Plan)執行結果如下
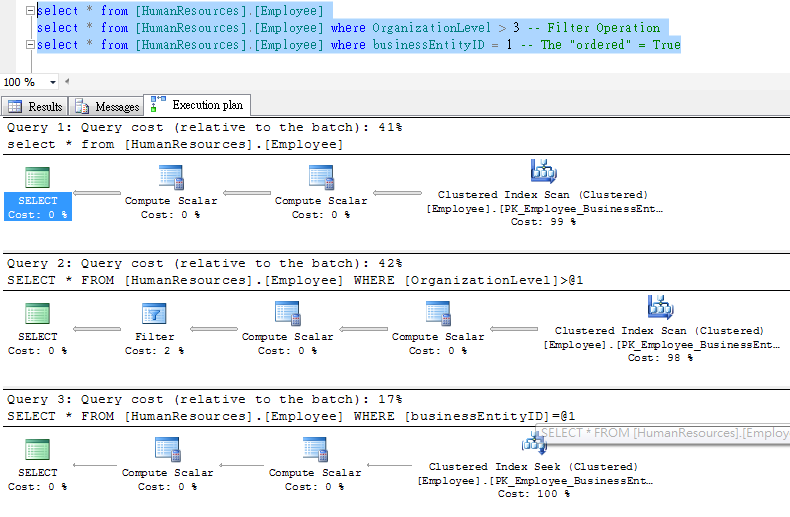
這個 Execution Plan 告訴我們幾件事情
1. Query Cost (relative to the batch)
- Query 1: Query Cost (relative to the batch): 41%
- Query 2: Query Cost (relative to the batch): 42%
- Query 3: Query Cost (relative to the batch): 17%
相對來說,Query 1 執行所需的成本為整體的 41%。
而 Query 3是這三個query 中有效率的執行,因為相對成本只有 17%
2. 傳回資料的多寡
每個 Operation 又到左的箭頭線條的粗細代表資料傳回的多寡
這個例子,Query 1/2 的連線箭頭相對於 Query 3 粗
因此 Query 1/2 所回傳的資料量也比較大
3. Operation
Operation 為 Execution plan 中每一個方塊的執行動作,
資料流從右到左執行相所需要的資料運算取得
例如:
Query 1/2 最右邊的 operation 為 “Clustered Index Scan”
Query 3 則是 “Clustered Index Seek”
Ps. 以Performance 來說,大部分的情況 Seek 的效能會比 Scan 好很多,
也就是我們會比較不希望看到 Scan 的出現,例如 Index Scan or Table Scan等
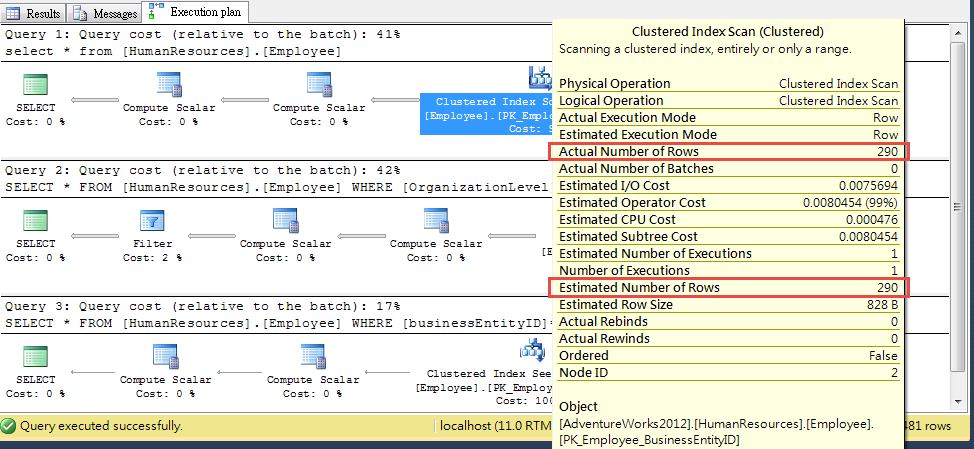
4. Estimated/Actual Number of Rows
Query optimizer 會對目前的資料狀態進行統計分析計算相關成本,
因此統計資訊抽樣的資訊是否可以代表實際資料量就很重要
因為統計資訊抽樣的誤差,也會導致optimizer 選擇錯誤的 Execution plan
那麼要如何知道目前的統計抽樣是否符合實際狀況呢?
於最右邊的 operation (這個例子為 clustered index),Tooltip 顯示
- Number of estimated Row: 290
- Number of Actual Row: 290
這兩個值越接近,表示統計抽樣資訊越代表實際執行狀況。
如果這兩個值差異很大,表示統計抽樣資訊有些失真。
資料庫管理員可以考慮手動更新該資料表的統計資訊。